What are Identity Markers?
Identity markers are single nucleotide polymorphisms (SNPs) used for:
- Sample identity verification (sample tracking)
- Detecting sample swaps or contamination
- Quality control across runs
Markers typically use common SNPs with:
- High heterozygosity rates
- Well-defined genotypes
- No clinical significance (non-pathogenic)
Compatible worksets
Markers are analyzed in the ID Check tab of analyses for the following worksets (when configured):
- GermlineVar and GermlineFamily (version ≥ 2.3)
- GermVar (version ≥ 3.1)
- SomaVar (version ≥ 2.5)
- SomaVar LF (version ≥ 2.1)
- SomaCGP (version ≥ 0.6)
How to Import Markers?
Step 1: Access the Marker Tab
- Go to Entity Settings → Markers
- Click on "+ Add marker"
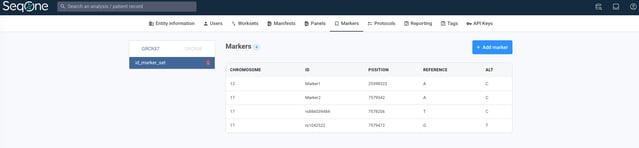
Step 2: Prepare Your Marker File
File requirements:
- Format: .tsv or .txt (tab-separated)
- Must include header row
- Five required columns:
Column definitions:
- CHR: Chromosome (format: chr1, chr2, chrX, chrY)
- ID: Marker identifier, typically rsID from dbSNP
- POS: Genomic position (must match your genome reference)
- REF: Reference allele (A, C, G, or T)
- ALT: Alternative allele (A, C, G, or T)
Example .tsv file:
CHR ID POS REF ALT chr1 rs1234567 1000000 A G chr1 rs2345678 1500000 C T chr2 rs3456789 2000000 G A Step 3: File Limitations
⚠️ Maximum 100 lines including the header
This means you can include up to 99 markers in a single file.
Step 4: Upload the File
- From the Markers tab, after you click + Add marker, select the genome reference (GRCh37 or GRCh38).
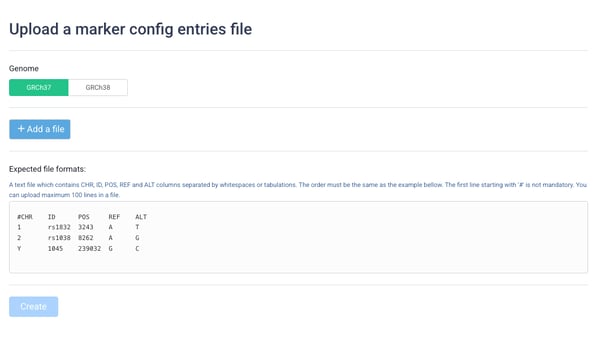
- Click "+ Add a file"
- Select you marker file from your computer
- Click "Create"
Automatic ID Check
Once markers are configured, the platform will automatically:
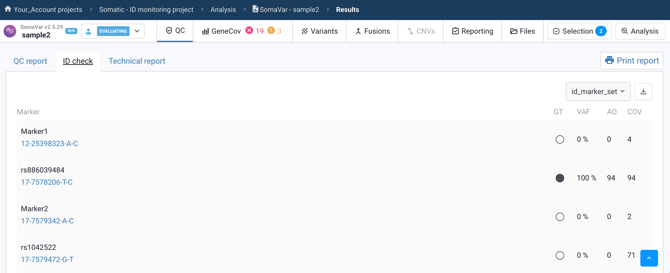
- Genotype the markers for each sample during analysis, measuring genotype match, VAF, alternate read count (AO), and coverage at each marker position.
- Display results in two places, at different scopes:
- Analysis level — the "ID check" tab in that analysis's QC section, with one row per marker and columns for GT (match indicator), VAF, AO, and coverage.
-
- Project level — the "ID check summary" in the project's QC tab, with one row per sample and one column per marker, showing a filled or empty circle to indicate a match at a glance across every sample in the project — useful for spotting swaps between different analyses or runs.
Viewing ID Check Results
- Analysis view: rows = markers, columns = GT / VAF / AO / COV for that sample.
- Project view: rows = samples, columns = markers, cells = filled (●) or empty (○) indicator.
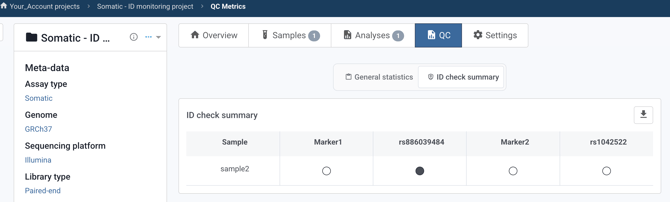
⬇️ Export: click the download icon to export the table in TSV format for external comparison or archiving.