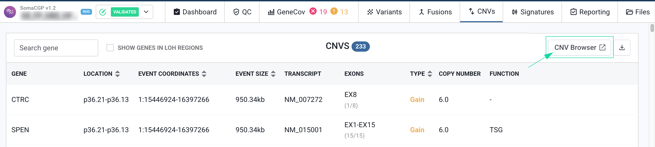
The CNV Browser graph, accessible by clicking on CNV Browser via the CNV tab in your analysis, is a visualization tool used to detect and interpret Copy Number Variations (CNVs) and related events, such as Loss of Heterozygosity (LoH). It achieves this by displaying the B-Allele Frequency (BAF) of single nucleotide polymorphisms (SNPs) across the genome.
What is B-Allele Frequency (BAF)?
The BAF is the observed frequency of the non-reference allele (B allele) for a germline heterozygous SNP.
- For a normal diploid region with no copy number change, heterozygous SNPs should have a BAF centered around 0.5 (since there is one A allele and one B allele).
- Deviations from the 0.5 line can signal underlying genomic events. In the context of CNV analysis, BAF information is crucial for highlighting:
- Allele-specific copy number alterations
- Loss of Heterozygosity (LoH)
- Allelic imbalance
By default, the graph represents the BAF of variants (y-axis) across the entire genome (x-axis), broken down by chromosome (1-22, X, and Y). A filter is provided in the upper left corner to display variants on a specific chromosome.
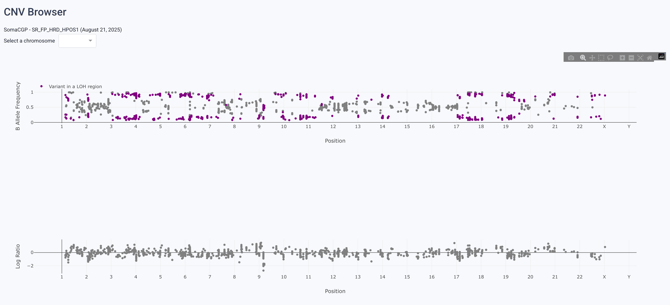
Note : The purple dots representing a LOH region encompass two types of events: LOH-Copy loss and LOH-Copy neutral. To distinguish between these two events, refer to the Log Ratio graph provided below.
How is the BAF Plot Generated?
The methodology for generating the BAF plot differs slightly depending on the analysis workflow.
1. In All Worksets Except SomaCGP
The BAF plot generation relies on intersecting your project data with a predefined set of SNP markers:
- Hotspot Intersect: An intersection is performed between the project manifest and a manifest containing a comprehensive dataset of Illumina SNP arrays and SNPs from other backbones, such as Agilent's OneSeq.
- Allele Counting: For each SNP position in the intersected set, read counts supporting the reference and alternative alleles are measured directly at that locus (independent of variant calling) — this is not pulled from the Variant Viewer's variant list.
- BAF Calculation: BAF = ALT reads / (REF reads + ALT reads) at that position. If there are no alternative-allele reads at a hotspot (e.g. no variant present), BAF is 0.
- No depth threshold: Every covered position is plotted, whatever its depth. Poorly covered positions can therefore produce extreme or scattered BAF values (a position with 2 reads can land on 0, 0.5 or 1). Interpret scatter in low-coverage regions with care.
- Gene annotation: Each point carries the gene name of its position, shown on hover, or intergenic if the SNP falls outside a gene.
2. In SomaCGP Worksets
The BAF Plot generation for the SomaCGP workflow uses a tumor-centric approach integrated with CNV calling:
- SNP Calling: SNVs are called by GATK Mutect2 and Freebayes, then the annotated and filtered (VAF ≥ 7.5 %, depth > 50×, quality ≥ 30) variants are passed to PureCN, which uses them (together with coverage) for CNV, LOH, and purity/ploidy estimation.
- Variant Selection: Only germline SNP are retained for the BAF plot.
- Exclusion: Homozygous SNVs are not taken into account in the detection of CNVs and LoH, as these markers are not informative for allelic imbalance.
- BAF value: The plotted frequency is PureCN's mapping-bias-adjusted allelic ratio, not a raw alternate/total read ratio. This correction reduces the scatter around the expected 0.5 and 1.0 bands.
❓Need help understanding your CNV Browser results? Our support team can help — reach out at support@seqone.com.